Strategy Tester Report
Gap_Trader
AlpariUK-Demo (Build 225)
| Symbol | GBPUSD (Great Britain Pound vs US Dollar) | ||||
| Period | 15 Minutes (M15) 2009.09.01 00:00 - 2009.10.15 23:45 (2009.09.01 - 2009.10.16) | ||||
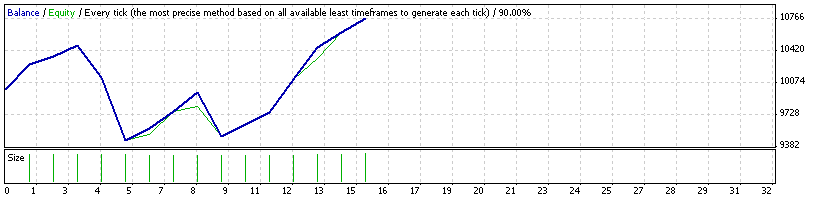
| Model | Every tick (the most precise method based on all available least timeframes) | ||||
| Parameters | GapRange=2; SL_Factor=10; TP_Factor=4; Risk=0.1; | ||||
| Bars in test | 4145 | Ticks modelled | 1656694 | Modelling quality | 90.00% |
| Mismatched charts errors | 0 | ||||
| Initial deposit | 10000.00 | ||||
| Total net profit | 773.75 | Gross profit | 2278.17 | Gross loss | -1504.42 |
| Profit factor | 1.51 | Expected payoff | 51.58 | ||
| Absolute drawdown | 684.73 | Maximal drawdown | 1260.73 (11.92%) | Relative drawdown | 11.92% (1260.73) |
| Total trades | 15 | Short positions (won %) | 8 (100.00%) | Long positions (won %) | 7 (57.14%) |
| Profit trades (% of total) | 12 (80.00%) | Loss trades (% of total) | 3 (20.00%) | ||
| Largest | profit trade | 358.98 | loss trade | -682.24 | |
| Average | profit trade | 189.85 | loss trade | -501.47 | |
| Maximum | consecutive wins (profit in money) | 6 (1275.77) | consecutive losses (loss in money) | 2 (-1031.36) | |
| Maximal | consecutive profit (count of wins) | 1275.77 (6) | consecutive loss (count of losses) | -1031.36 (2) | |
| Average | consecutive wins | 4 | consecutive losses | 2 | |
| # | Time | Type | Order | Size | Price | S / L | T / P | Profit | Balance |
| 1 | 2009.09.02 16:00 | buy | 1 | 0.32 | 1.62315 | 1.60198 | 1.63162 | ||
| 2 | 2009.09.03 08:04 | t/p | 1 | 0.32 | 1.63162 | 1.60198 | 1.63162 | 272.00 | 10272.00 |
| 3 | 2009.09.07 00:00 | sell | 2 | 0.32 | 1.63935 | 1.64609 | 1.63665 | ||
| 4 | 2009.09.07 17:56 | t/p | 2 | 0.32 | 1.63665 | 1.64609 | 1.63665 | 86.40 | 10358.40 |
| 5 | 2009.09.14 00:00 | sell | 3 | 0.32 | 1.66841 | 1.67789 | 1.66462 | ||
| 6 | 2009.09.14 02:11 | t/p | 3 | 0.32 | 1.66462 | 1.67789 | 1.66462 | 121.28 | 10479.68 |
| 7 | 2009.09.14 02:22 | buy | 4 | 0.32 | 1.66271 | 1.65179 | 1.66708 | ||
| 8 | 2009.09.15 11:30 | s/l | 4 | 0.32 | 1.65179 | 1.65179 | 1.66708 | -349.12 | 10130.56 |
| 9 | 2009.09.17 19:33 | buy | 5 | 0.32 | 1.64456 | 1.62323 | 1.65309 | ||
| 10 | 2009.09.18 18:18 | s/l | 5 | 0.32 | 1.62323 | 1.62323 | 1.65309 | -682.24 | 9448.32 |
| 11 | 2009.09.18 22:30 | sell | 6 | 0.31 | 1.62435 | 1.63491 | 1.62013 | ||
| 12 | 2009.09.21 00:00 | buy | 7 | 0.31 | 1.62184 | 1.60638 | 1.62802 | ||
| 13 | 2009.09.21 07:15 | t/p | 6 | 0.31 | 1.62013 | 1.63491 | 1.62013 | 130.45 | 9578.77 |
| 14 | 2009.09.22 08:24 | t/p | 7 | 0.31 | 1.62802 | 1.60638 | 1.62802 | 191.89 | 9770.66 |
| 15 | 2009.09.23 10:30 | sell | 8 | 0.31 | 1.63419 | 1.65045 | 1.62769 | ||
| 16 | 2009.09.24 00:00 | buy | 9 | 0.31 | 1.63263 | 1.61737 | 1.63873 | ||
| 17 | 2009.09.24 09:30 | t/p | 8 | 0.31 | 1.62769 | 1.65045 | 1.62769 | 200.38 | 9971.04 |
| 18 | 2009.09.24 12:24 | s/l | 9 | 0.31 | 1.61737 | 1.61737 | 1.63873 | -473.06 | 9497.98 |
| 19 | 2009.09.24 23:00 | sell | 10 | 0.31 | 1.60605 | 1.61668 | 1.60180 | ||
| 20 | 2009.09.25 01:40 | t/p | 10 | 0.31 | 1.60180 | 1.61668 | 1.60180 | 131.38 | 9629.36 |
| 21 | 2009.09.28 00:00 | sell | 11 | 0.31 | 1.59667 | 1.60672 | 1.59265 | ||
| 22 | 2009.09.28 00:19 | t/p | 11 | 0.31 | 1.59265 | 1.60672 | 1.59265 | 124.62 | 9753.98 |
| 23 | 2009.09.29 12:30 | buy | 12 | 0.31 | 1.59487 | 1.56594 | 1.60644 | ||
| 24 | 2009.09.30 08:36 | t/p | 12 | 0.31 | 1.60644 | 1.56594 | 1.60644 | 358.98 | 10112.96 |
| 25 | 2009.09.30 17:30 | sell | 13 | 0.32 | 1.59930 | 1.62632 | 1.58849 | ||
| 26 | 2009.10.02 01:15 | buy | 14 | 0.32 | 1.59187 | 1.57936 | 1.59687 | ||
| 27 | 2009.10.02 02:06 | t/p | 13 | 0.32 | 1.58849 | 1.62632 | 1.58849 | 344.38 | 10457.34 |
| 28 | 2009.10.05 02:09 | t/p | 14 | 0.32 | 1.59687 | 1.57936 | 1.59687 | 160.32 | 10617.66 |
| 29 | 2009.10.12 00:00 | sell | 15 | 0.33 | 1.58568 | 1.59750 | 1.58095 | ||
| 30 | 2009.10.12 08:30 | t/p | 15 | 0.33 | 1.58095 | 1.59750 | 1.58095 | 156.09 | 10773.75 |