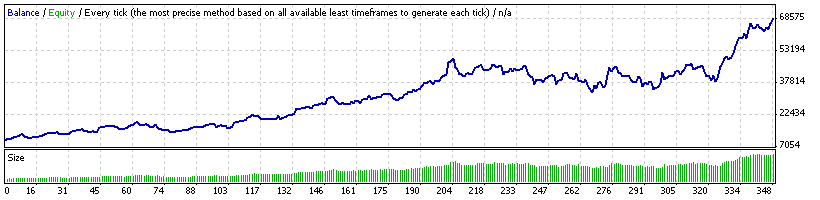
Strategy Tester Report
NOC without NN
| Symbol | EURUSD (Euro vs US Dollar (1 Lot = 100 000 EUR)) | ||||
| Period | 1 Hour (H1) 2006.01.02 01:00 - 2008.07.15 23:00 (2006.01.01 - 2008.07.16) | ||||
| Model | Every tick (the most precise method based on all available least timeframes) | ||||
| Parameters | dBuyLevel=0.54; dSellLevel=0.74; dStopLoss=200; dTrailingStop=174; risk=0.05; | ||||
| Bars in test | 16661 | Ticks modelled | 4409254 | Modelling quality | n/a |
| Mismatched charts errors | 467 | ||||
| Initial deposit | 10000.00 | ||||
| Total net profit | 58929.84 | Gross profit | 207259.67 | Gross loss | -148329.84 |
| Profit factor | 1.40 | Expected payoff | 169.34 | ||
| Absolute drawdown | 205.00 | Maximal drawdown | 16967.99 (34.00%) | Relative drawdown | 34.00% (16967.99) |
| Total trades | 348 | Short positions (won %) | 160 (45.00%) | Long positions (won %) | 188 (66.49%) |
| Profit trades (% of total) | 197 (56.61%) | Loss trades (% of total) | 151 (43.39%) | ||
| Largest | profit trade | 6148.48 | loss trade | -4395.36 | |
| Average | profit trade | 1052.08 | loss trade | -982.32 | |
| Maximum | consecutive wins (profit in money) | 7 (5070.78) | consecutive losses (loss in money) | 4 (-8964.74) | |
| Maximal | consecutive profit (count of wins) | 11675.47 (5) | consecutive loss (count of losses) | -8964.74 (4) | |
| Average | consecutive wins | 2 | consecutive losses | 2 | |